Analysis
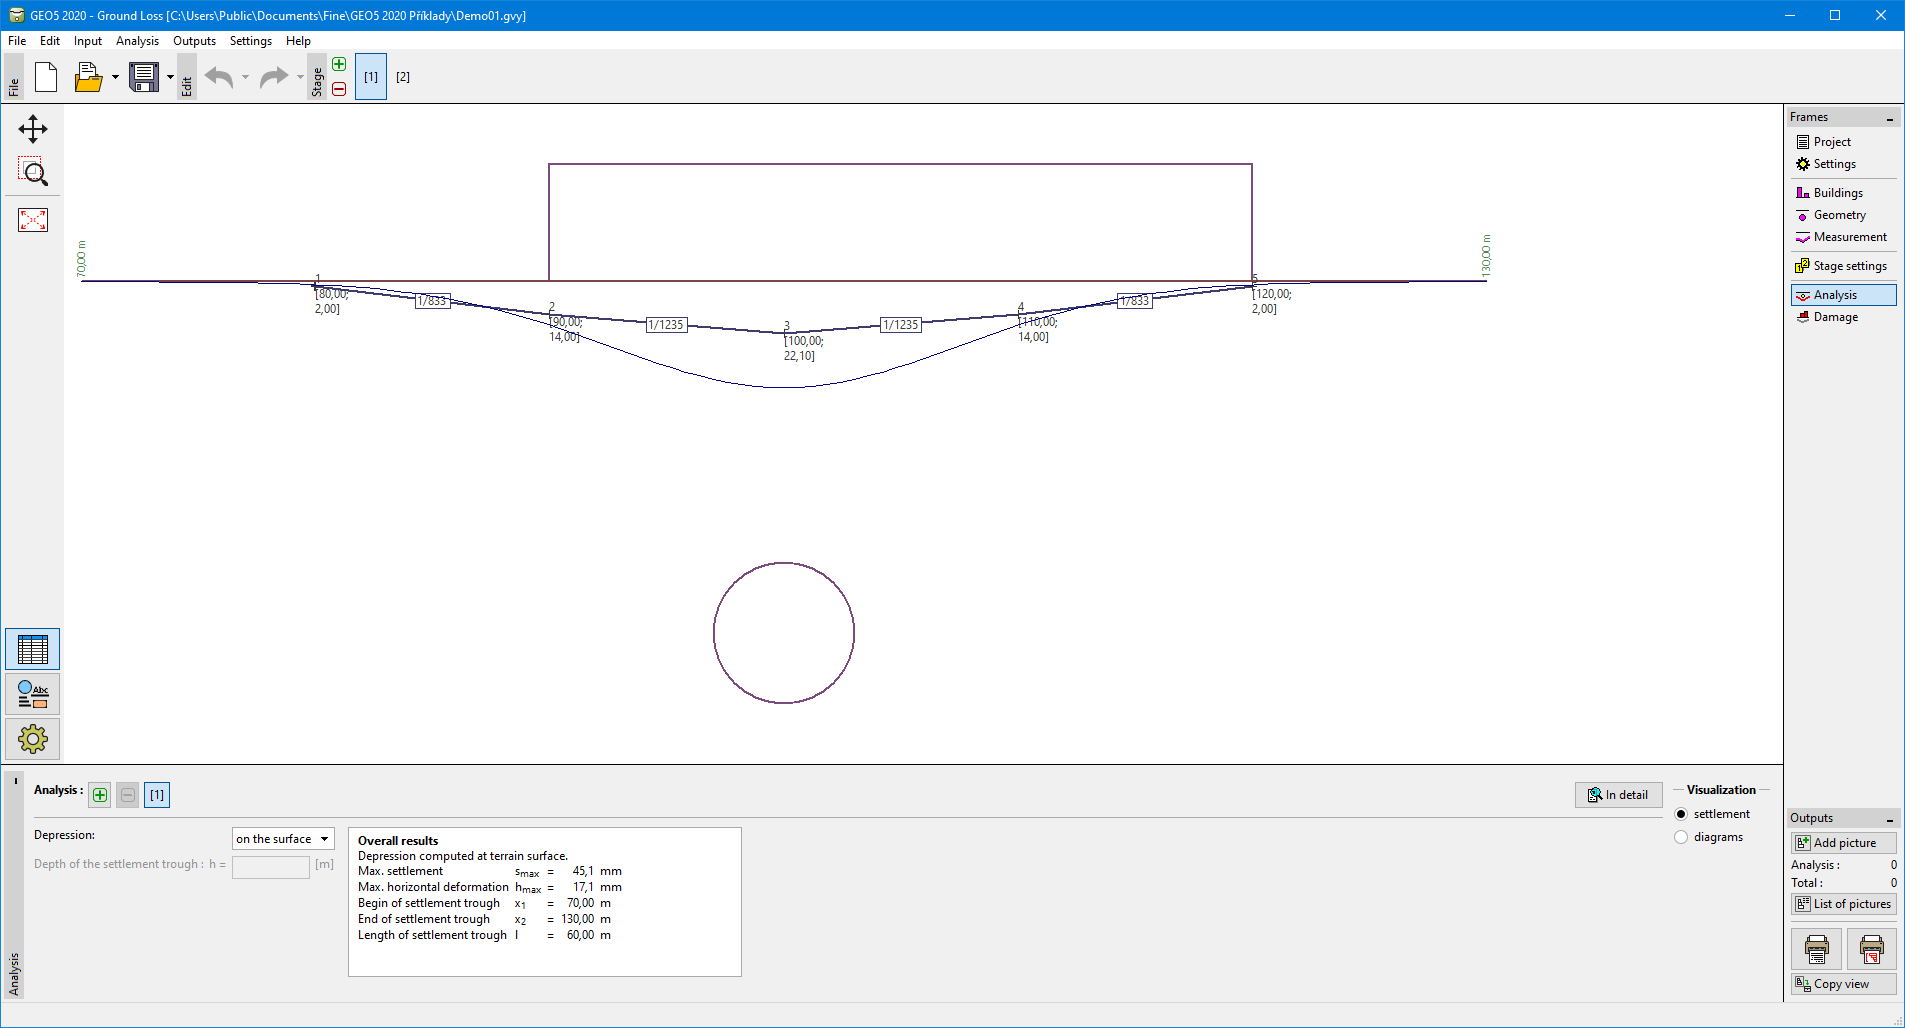
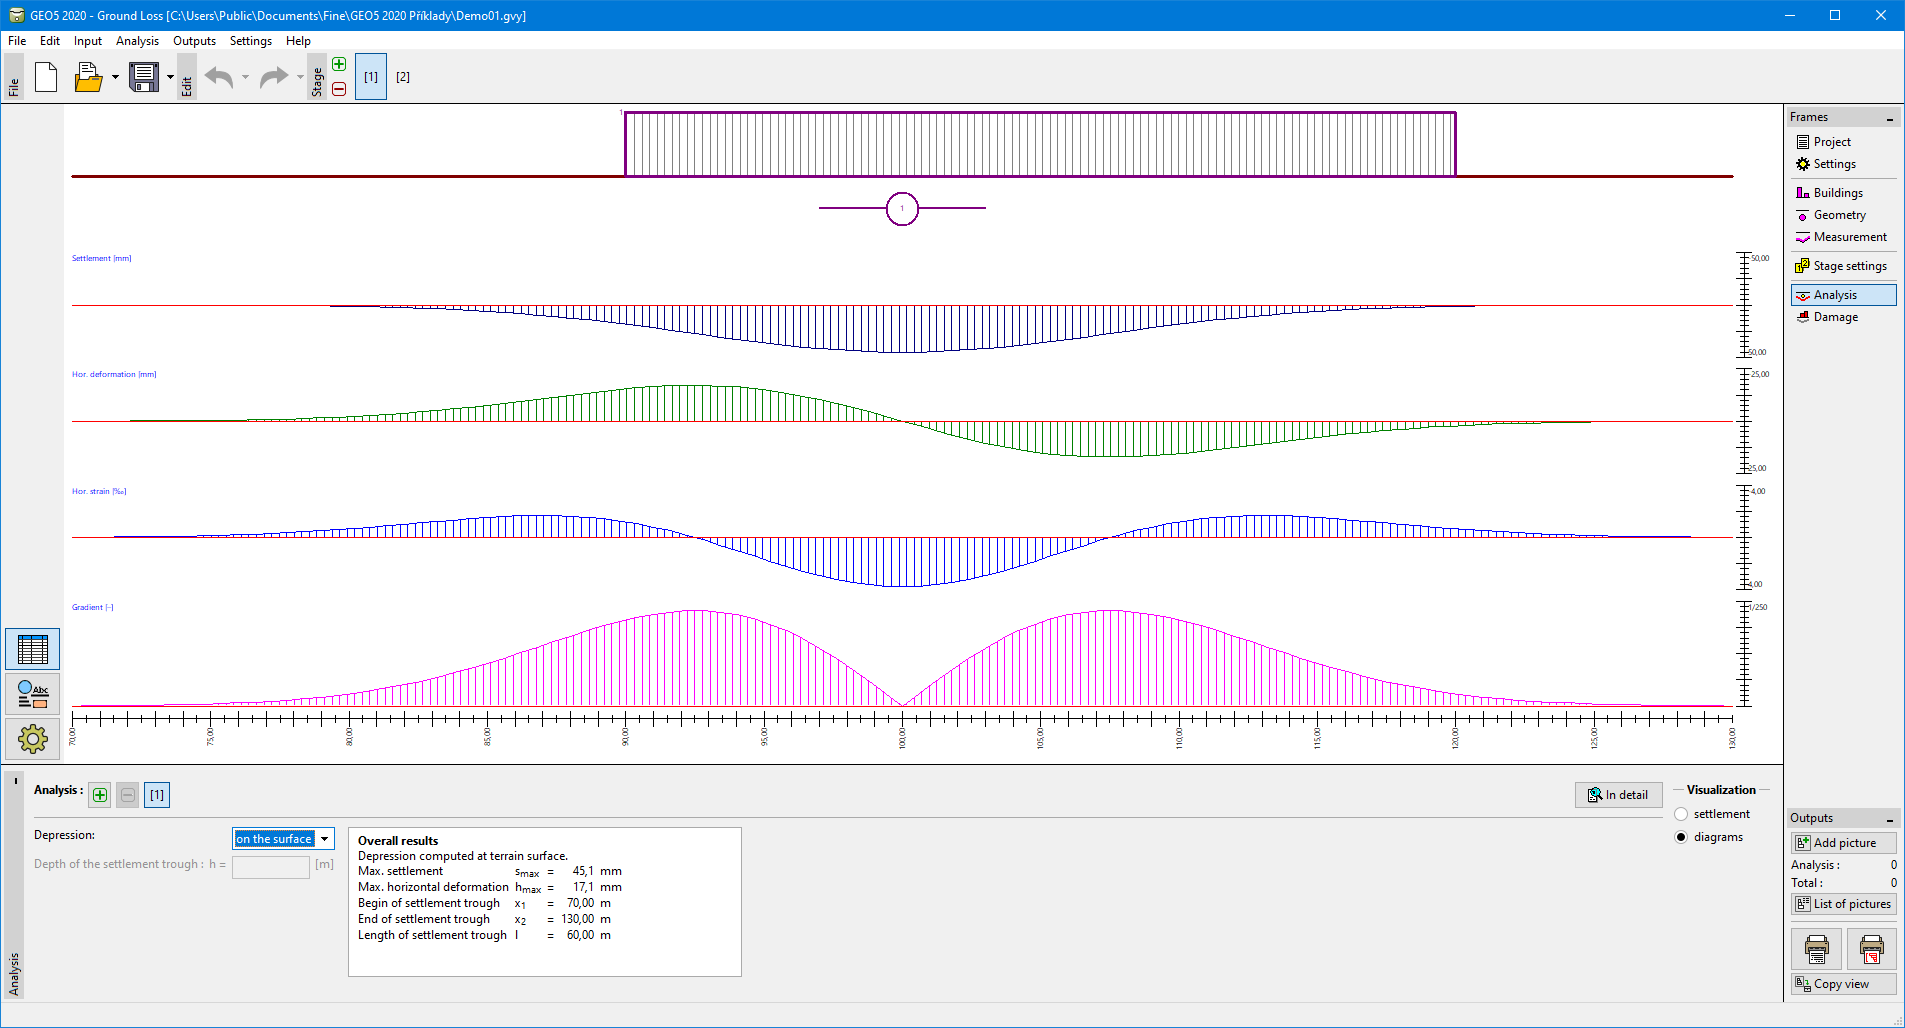
The frame "Analysis" provides the results from the analysis of subsidence trough. More than one analysis at different depths below the terrain surface can be performed for a single task. The computed values are displayed on a desktop and are continuously updated whenever a change in the input data is done.
Visualization of results can be adjusted in the frame "Drawing Settings". For a quick switch between different styles of graphical presentation of results (subsidence trough, distribution of values), the user may use the buttons in section "Visualization".
 Frame "Analysis" - "Settlement"
 Frame "Analysis" - "Diagrams"